SGB Site Index
 Player Ratings
PEVA Player Ratings
2020

Check out Baseball's Best @ 150 Book, a comprehensive guide to the best players, pitchers, and fielders in baseball history at the 150th Anniversary of the Major Leagues (1871-2020) with more than 8,000 rankings, including All-Time teams of your favorite current franchise. Now available in paperback and ebook.

2020 Fielding Ratings
Individual Player (Regular Season)
-
2020 Field Value Ratings
First Base
Second Base
Third Base
Shortstop
Catcher
Outfield
Pitcher
-
Field Value 2020
CATCHER
| Rank | Year | NameLast | NameFirst | Tm | Lg | POS | INN | FPCT. | RF | CS% | FV |
| 1 | 2020 | Perez | Roberto | CLE | AL | C | 256.0 | 1.000 | 10.97 | 0.714 | 2.10 |
| 2 | 2020 | Barnhart | Tucker | CIN | NL | C | 272.3 | 1.000 | 11.76 | 0.364 | 2.03 |
| 3 | 2020 | Pina | Manny | MIL | NL | C | 98.3 | 1.000 | 11.35 | 0.556 | 1.95 |
| 4 | 2020 | Heim | Jonah | OAK | AL | C | 95.0 | 1.000 | 10.52 | 0.600 | 1.92 |
| 5 | 2020 | Ramos | Wilson | NYN | NL | C | 327.3 | 0.998 | 11.14 | 0.176 | 1.91 |
| 6 | 2020 | Vazquez | Christian | BOS | AL | C | 356.0 | 0.997 | 9.83 | 0.300 | 1.91 |
| 7 | 2020 | Perez | Salvador | KCA | AL | C | 274.0 | 1.000 | 9.89 | 0.273 | 1.89 |
| 8 | 2020 | Maldonado | Martin | HOU | AL | C | 392.0 | 0.995 | 9.11 | 0.316 | 1.85 |
| 9 | 2020 | Suzuki | Kurt | WAS | NL | C | 251.7 | 1.000 | 10.05 | 0.152 | 1.84 |
| 10 | 2020 | Smith | Will | LAN | NL | C | 276.7 | 1.000 | 9.11 | 0.227 | 1.83 |
| 11 | 2020 | Garver | Mitch | MIN | AL | C | 169.0 | 1.000 | 9.80 | 0.357 | 1.83 |
| 12 | 2020 | Nola | Austin | SDN | NL | C | 330.0 | 0.995 | 9.95 | 0.269 | 1.81 |
| 13 | 2020 | Romine | Austin | DET | AL | C | 307.0 | 1.000 | 8.09 | 0.207 | 1.81 |
| 14 | 2020 | Bemboom | Anthony | LAA | AL | C | 144.0 | 1.000 | 9.44 | 0.412 | 1.81 |
| 15 | 2020 | Casali | Curt | CIN | NL | C | 212.7 | 0.996 | 11.30 | 0.200 | 1.80 |
| 16 | 2020 | Zunino | Mike | TBA | AL | C | 215.7 | 0.996 | 10.81 | 0.267 | 1.80 |
| 17 | 2020 | Kratz | Erik | NYA | AL | C | 72.0 | 1.000 | 9.63 | 0.400 | 1.80 |
| 18 | 2020 | Vogt | Stephen | ARI | NL | C | 170.0 | 1.000 | 10.11 | 0.211 | 1.79 |
| 19 | 2020 | Stallings | Jacob | PIT | NL | C | 345.3 | 0.990 | 10.45 | 0.333 | 1.78 |
| 20 | 2020 | Murphy | Sean | OAK | AL | C | 339.3 | 0.994 | 9.23 | 0.286 | 1.78 |
| 21 | 2020 | Wieters | Matt | SLN | NL | C | 97.7 | 1.000 | 11.15 | 0.000 | 1.78 |
| 22 | 2020 | Chirinos | Robinson | NYN | NL | C | 191.3 | 1.000 | 10.16 | 0.143 | 1.78 |
| 23 | 2020 | Smith | Kevan | TBA | AL | C | 80.0 | 1.000 | 8.55 | 0.500 | 1.78 |
| 24 | 2020 | Grandal | Yasmani | CHA | AL | C | 271.3 | 0.993 | 9.42 | 0.462 | 1.77 |
| 25 | 2020 | Jeffers | Ryan | MIN | AL | C | 162.0 | 1.000 | 10.39 | 0.125 | 1.77 |
| 26 | 2020 | Contreras | Willson | CHN | NL | C | 324.3 | 0.994 | 8.99 | 0.346 | 1.77 |
| 27 | 2020 | Jansen | Danny | TOR | AL | C | 342.3 | 0.994 | 9.25 | 0.231 | 1.77 |
| 28 | 2020 | Narvaez | Omar | MIL | NL | C | 285.0 | 0.991 | 10.80 | 0.304 | 1.76 |
| 29 | 2020 | Perez | Michael | TBA | AL | C | 232.0 | 0.996 | 9.58 | 0.316 | 1.76 |
| 30 | 2020 | Castro | Jason | LAA | AL | C | 200.7 | 0.996 | 10.32 | 0.267 | 1.75 |
| 31 | 2020 | Wallach | Chad | MIA | NL | C | 112.3 | 1.000 | 9.13 | 0.333 | 1.75 |
| 32 | 2020 | Taylor | Beau | CLE | AL | C | 60.0 | 0.988 | 11.85 | 0.500 | 1.74 |
| 33 | 2020 | Caratini | Victor | CHN | NL | C | 180.0 | 0.995 | 10.15 | 0.333 | 1.74 |
| 34 | 2020 | Molina | Yadier | SLN | NL | C | 337.3 | 0.985 | 8.62 | 0.455 | 1.72 |
| 35 | 2020 | Realmuto | J.T. | PHI | NL | C | 291.0 | 0.993 | 9.40 | 0.250 | 1.72 |
| 36 | 2020 | Sanchez | Gary | NYA | AL | C | 321.7 | 0.984 | 10.10 | 0.263 | 1.72 |
| 37 | 2020 | Stassi | Max | LAA | AL | C | 238.7 | 0.996 | 9.65 | 0.158 | 1.71 |
| 38 | 2020 | Greiner | Grayson | DET | AL | C | 137.0 | 1.000 | 9.07 | 0.200 | 1.70 |
| 39 | 2020 | Butera | Drew | COL | NL | C | 116.7 | 1.000 | 7.25 | 0.286 | 1.69 |
| 40 | 2020 | McGuire | Reese | TOR | AL | C | 111.0 | 0.978 | 11.03 | 0.500 | 1.69 |
| 41 | 2020 | Hedges | Austin | CLE | AL | C | 210.3 | 0.996 | 10.06 | 0.400 | 1.69 |
| 42 | 2020 | Nottingham | Jacob | MIL | NL | C | 134.0 | 0.989 | 12.43 | 0.250 | 1.68 |
| 43 | 2020 | Knapp | Andrew | PHI | NL | C | 183.0 | 0.991 | 11.36 | 0.222 | 1.68 |
| 44 | 2020 | Wolters | Tony | COL | NL | C | 283.7 | 0.996 | 7.71 | 0.150 | 1.68 |
| 45 | 2020 | Kelly | Carson | ARI | NL | C | 289.3 | 0.993 | 9.46 | 0.136 | 1.68 |
| 46 | 2020 | Torrens | Luis | SDN | NL | C | 177.0 | 1.000 | 8.24 | 0.167 | 1.67 |
| 47 | 2020 | Plawecki | Kevin | BOS | AL | C | 158.3 | 0.994 | 9.95 | 0.250 | 1.66 |
| 48 | 2020 | Severino | Pedro | BAL | AL | C | 275.7 | 0.986 | 9.24 | 0.308 | 1.65 |
| 49 | 2020 | Allen | Austin | OAK | AL | C | 81.0 | 1.000 | 8.56 | 0.143 | 1.64 |
| 50 | 2020 | McCann | James | CHA | AL | C | 245.7 | 0.985 | 9.42 | 0.333 | 1.64 |
| 51 | 2020 | Barnes | Austin | LAN | NL | C | 245.0 | 0.992 | 9.22 | 0.238 | 1.63 |
| 52 | 2020 | Diaz | Elias | COL | NL | C | 126.0 | 1.000 | 6.29 | 0.125 | 1.63 |
| 53 | 2020 | Odom | Joseph | SEA | AL | C | 122.7 | 1.000 | 8.29 | 0.059 | 1.63 |
| 54 | 2020 | Leon | Sandy | CLE | AL | C | 186.0 | 0.978 | 10.98 | 0.182 | 1.62 |
| 55 | 2020 | Bart | Joey | SFN | NL | C | 231.3 | 0.992 | 9.57 | 0.179 | 1.62 |
| 56 | 2020 | Flowers | Tyler | ATL | NL | C | 184.0 | 0.995 | 9.10 | 0.118 | 1.59 |
| 57 | 2020 | Gomes | Yan | WAS | NL | C | 252.0 | 0.992 | 8.71 | 0.182 | 1.58 |
| 58 | 2020 | Tromp | Chadwick | SFN | NL | C | 160.3 | 0.993 | 8.25 | 0.333 | 1.58 |
| 59 | 2020 | d'Arnaud | Travis | ATL | NL | C | 295.3 | 0.990 | 8.93 | 0.111 | 1.57 |
| 60 | 2020 | Higashioka | Kyle | NYA | AL | C | 107.0 | 0.983 | 9.67 | 0.375 | 1.57 |
| 61 | 2020 | Mathis | Jeff | TEX | AL | C | 182.3 | 0.989 | 9.08 | 0.333 | 1.57 |
| 62 | 2020 | Murphy | John Ryan | PIT | NL | C | 159.7 | 0.988 | 9.58 | 0.308 | 1.57 |
| 63 | 2020 | Trevino | Jose | TEX | AL | C | 151.0 | 0.994 | 9.30 | 0.091 | 1.55 |
| 64 | 2020 | Avila | Alex | MIN | AL | C | 150.3 | 0.981 | 9.52 | 0.273 | 1.55 |
| 65 | 2020 | Heineman | Tyler | SFN | NL | C | 118.0 | 0.975 | 9.08 | 0.385 | 1.55 |
| 66 | 2020 | Gallagher | Cam | KCA | AL | C | 162.0 | 0.994 | 8.89 | 0.000 | 1.55 |
| 67 | 2020 | Garneau | Dustin | HOU | AL | C | 110.7 | 0.969 | 10.25 | 0.176 | 1.55 |
| 68 | 2020 | Alfaro | Jorge | MIA | NL | C | 217.3 | 0.990 | 7.91 | 0.200 | 1.55 |
| 69 | 2020 | Sisco | Chance | BAL | AL | C | 184.0 | 0.989 | 8.71 | 0.188 | 1.55 |
| 70 | 2020 | Cervelli | Francisco | MIA | NL | C | 130.3 | 0.992 | 8.77 | 0.000 | 1.55 |
| 71 | 2020 | Nido | Tomas | NYN | NL | C | 60.0 | 0.983 | 8.70 | 0.167 | 1.55 |
| 72 | 2020 | Mejia | Francisco | SDN | NL | C | 101.0 | 0.990 | 8.91 | 0.000 | 1.55 |
| 73 | 2020 | Huff | Sam | TEX | AL | C | 78.0 | 0.970 | 7.38 | 0.000 | 1.55 |
| 74 | 2020 | Viloria | Meibrys | KCA | AL | C | 71.0 | 0.985 | 8.24 | 0.000 | 1.55 |
Silver Mitt Award Winners
| Position | American League | National League |
| OF | Ramon
Laureano, OAK Kevin Kiermeier, TBA Joey Gallo, TEX |
Michael Conforto, NYN Victor Robles, WAS Charlie Blackmon, COL |
| 1B | Yuli Gurriel, HOU | Anthony Rizzo, CHN |
| 2B | Nicky Lopez, KCA | Kolten Wong, SLN |
| 3B | Kyle Seager, SEA | Nolan Arenado, COL |
| SS | Carlos Correa, HOU | Dansby Swanson, ATL |
| C | Roberto Perez, KCA | Tucker Barnhart, CIN |
| P | Kyle Gibson, TEX | Kyle Hendricks, CHN |
| Fielding Ratings | ||
| Outfield | First Base | Second Base |
| Third Base | Shortstop | Catcher |
| Pitcher |
- What is Field Value?
- FV Details
What is Field Value?
Each position has different maximum, average, and minimum rating values per the difficulty and value of that position, which folds into the overall value of PEVA for that season.
FV Scale Maximums
Catcher - 2.10Shortstop - 1.75
Outfield - 1.70
Third Base - 1.70
Second Base - 1.50
First Base - 1.40
Pitcher - 1.15
For more information on FV, PEVA, and our other stats, see the About Our Stats page and other pages listed there.
Silver Mitt Awards
Are Baseball Evaluation's version of the Golden Gloves. Check to see just where the Gold Glove winners of this year fit into the Field Value and Silver Mitt rankings.Note: Bold reflects 2020 Gold Glove Winner
Silver Mitt Award Winner - Minimum 900 Innings Played (prorated 333 IP
in 2020, 250 for C) at the position,
except Pitcher 162 Innings Played (prorated 60 in 2020).
Fielding Statistics (Preliminary) at end of regular season. Based on
Innings
Played, Fielding Percentage, Range Factor, Stolen Base Percentage
Caught (Catcher and Pitcher), Assists per 9 IP (OF). Fielding Ratings
given for all players with minimum of 162 Innings Played at each
position.
Fielding Ratings in the Stat Geek Baseball PEVA system are meant to
give a grade that relates to value for payroll purposes. A player with
a low amount of innings played at a position may be rated lower for
that purpose, but be a better defensive player. They would be rated
higher in the PEVA/FV system with higher innings played, but their FV
is lower due to lack of use.
Notes: Photo/Image Credits: Paul Goldschmidt; Wikipedia
Commons
Baseball Evaluation, Stat Geek Baseball, and all materials on this site
are the 2020 Copyright and intellectual property of JDP ECON and their
licensors. All worldwide rights reserved. The Baseball Evaluation
system was developed independently of Major League Baseball and the
Major League Baseball Players Association and is not endorsed by or
associated in any way with either organization.
Note: All Baseball Evaluation Stats and Stat Geek Baseball Stats were
developed by JDP Econ & are the proprietary property of JDP
ECON. All rights reserved. If Baseball Evaluation stats are used in
articles, etc., please credit statgeekbaseball.com or
baseballevaluation.com.
For more on the Best Teams Ever, including the Top 50 batting,
pitching, and total teams, plus more, check out Stat Geek Baseball, the
Best Ever Book below.
More Baseball
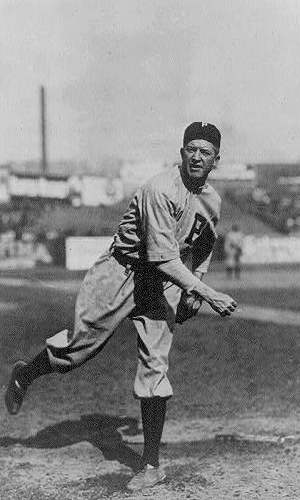
Grover Cleveland Alexander

Ty Cobb
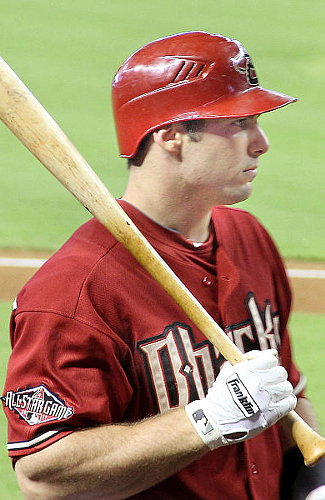
Paul Goldschmidt