BATTING 1-20
| Rank | Year | Name | LastName | Team | HR | RBI | AVG | OBP | SLG | RPR | FV | PEVA-B |
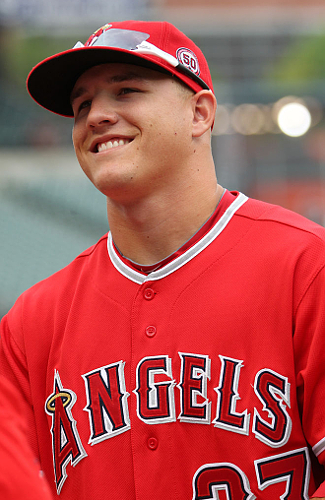
| 1 | 2016 | Mike | Trout | LAA | 29 | 100 | 0.315 | 0.441 | 0.550 | 223 | 1.55 | 40.170 |
| 2 | 2016 | Joey | Votto | CIN | 29 | 97 | 0.326 | 0.434 | 0.550 | 198 | 1.08 | 26.582 |
| 3 | 2016 | Josh | Donaldson | TOR | 37 | 99 | 0.284 | 0.404 | 0.549 | 221 | 1.46 | 26.376 |
| 4 | 2016 | Jose | Altuve | HOU | 24 | 96 | 0.338 | 0.396 | 0.531 | 204 | 1.22 | 26.036 |
| 5 | 2016 | Kris | Bryant | CHN | 39 | 102 | 0.292 | 0.385 | 0.554 | 223 | 1.27 | 25.409 |
| 6 | 2016 | Freddie | Freeman | ATL | 34 | 91 | 0.302 | 0.400 | 0.569 | 193 | 1.24 | 25.328 |
| 7 | 2016 | Miguel | Cabrera | DET | 38 | 108 | 0.316 | 0.393 | 0.563 | 200 | 1.13 | 24.557 |
| 8 | 2016 | Nolan | Arenado | COL | 41 | 133 | 0.294 | 0.362 | 0.570 | 249 | 1.70 | 22.940 |
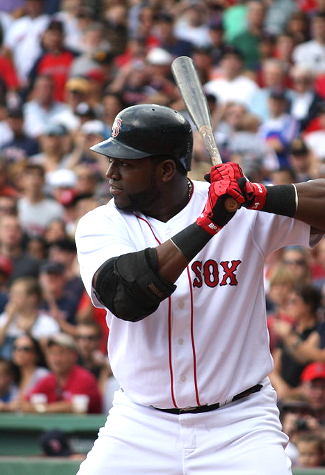
| 9 | 2016 | David | Ortiz | BOS | 38 | 127 | 0.315 | 0.401 | 0.620 | 206 | 0.85 | 22.451 |
| 10 | 2016 | Robinson | Cano | SEA | 39 | 103 | 0.298 | 0.350 | 0.533 | 210 | 1.50 | 22.255 |
| 11 | 2016 | Mookie | Betts | BOS | 31 | 113 | 0.318 | 0.363 | 0.534 | 235 | 1.66 | 22.227 |
| 12 | 2016 | Anthony | Rizzo | CHN | 32 | 109 | 0.292 | 0.385 | 0.544 | 203 | 1.25 | 22.092 |
| 13 | 2016 | Kyle | Seager | SEA | 30 | 99 | 0.278 | 0.359 | 0.499 | 188 | 1.63 | 20.517 |
| 14 | 2016 | Nelson | Cruz | SEA | 43 | 105 | 0.287 | 0.360 | 0.555 | 201 | 1.16 | 20.393 |
| 15 | 2016 | Daniel | Murphy | WAS | 25 | 104 | 0.347 | 0.390 | 0.595 | 192 | 1.01 | 19.941 |
| 16 | 2016 | Paul | Goldschmidt | ARI | 24 | 95 | 0.297 | 0.411 | 0.489 | 201 | 1.40 | 19.659 |
| 17 | 2016 | Corey | Seager | LAN | 26 | 72 | 0.308 | 0.365 | 0.512 | 177 | 1.39 | 19.204 |
| 18 | 2016 | George | Springer | HOU | 29 | 82 | 0.261 | 0.359 | 0.457 | 198 | 1.57 | 19.180 |
| 19 | 2016 | Edwin | Encarnacion | TOR | 42 | 127 | 0.263 | 0.357 | 0.529 | 226 | 1.00 | 18.318 |
| 20 | 2016 | Brian | Dozier | MIN | 42 | 99 | 0.268 | 0.340 | 0.546 | 203 | 1.36 | 17.881 |
- Individual by Team
- PEVA Details
- Baseball Tickets
INDIVIDUAL BY TEAM 2016
AMERICAN LEAGUE
Los
Angeles Angels of Anaheim
Baltimore
Orioles
Boston
Red Sox
Chicago
White Sox
Cleveland
Indians
Detroit
Tigers
Houston
Astros
Kansas
City Royals
Minnesota
Twins
New
York Yankees
Oakland
Athletics
Seattle
Mariners
Tampa
Bay Rays
Texas
Rangers
Toronto
Blue Jays
NATIONAL LEAGUE
Arizona
Diamondbacks
Atlanta
Braves
Chicago
Cubs
Cincinnati
Reds
Colorado
Rockies
Los
Angeles Dodgers
Miami
Marlins
Milwaukee
Brewers
New
York Mets
Philadelphia
Phillies
Pittsburgh
Pirates
San
Diego Padres
San
Francisco Giants
St.
Louis Cardinals
Washington Nationals
Atlanta Braves
Chicago Cubs
Cincinnati Reds
Colorado Rockies
Los Angeles Dodgers
Miami Marlins
Milwaukee Brewers
New York Mets
Philadelphia Phillies
Pittsburgh Pirates
San Diego Padres
San Francisco Giants
St. Louis Cardinals
Washington Nationals
Note: HR/RBI/OBP/SLG/FV (field Value) for Position Players, W/SV/IP/ERA for Pitchers, and Final 2016 PEVA Player Rating thru games of October 2, 2016. Using Preliminary Final Park Factors.
 Player Ratings


